Rule Engine
A Rule Engine provides a framework for the automated and scalable evaluation and execution of business rules or decision logic. By decoupling business rules from the core application code, this architecture enables independent definition, management, and execution of these rules. When an event stream triggers a match with a defined rule criteria, an "incident" record is generated. A detailed explanation of the "incident" concept follows.
Rule Engines are commonly used in various domains, including finance, insurance, healthcare, e-commerce, cyber security and telecommunications, to automate decision-making processes and enforce business policies.

An example of rule: let's you want to monitoring computer network firewall and temporarily block traffic if there more than 100MB data exfiltrating to an IP address within a time period of 5 minutes that belong to a certain geographic region (e.g. Russia) as an example.
Avalanchio rule engine run the rules very close to the storage layer providing the system ability to run many rules concurrency with low latency.
Rule Attributes
| Attribute | Description |
|---|---|
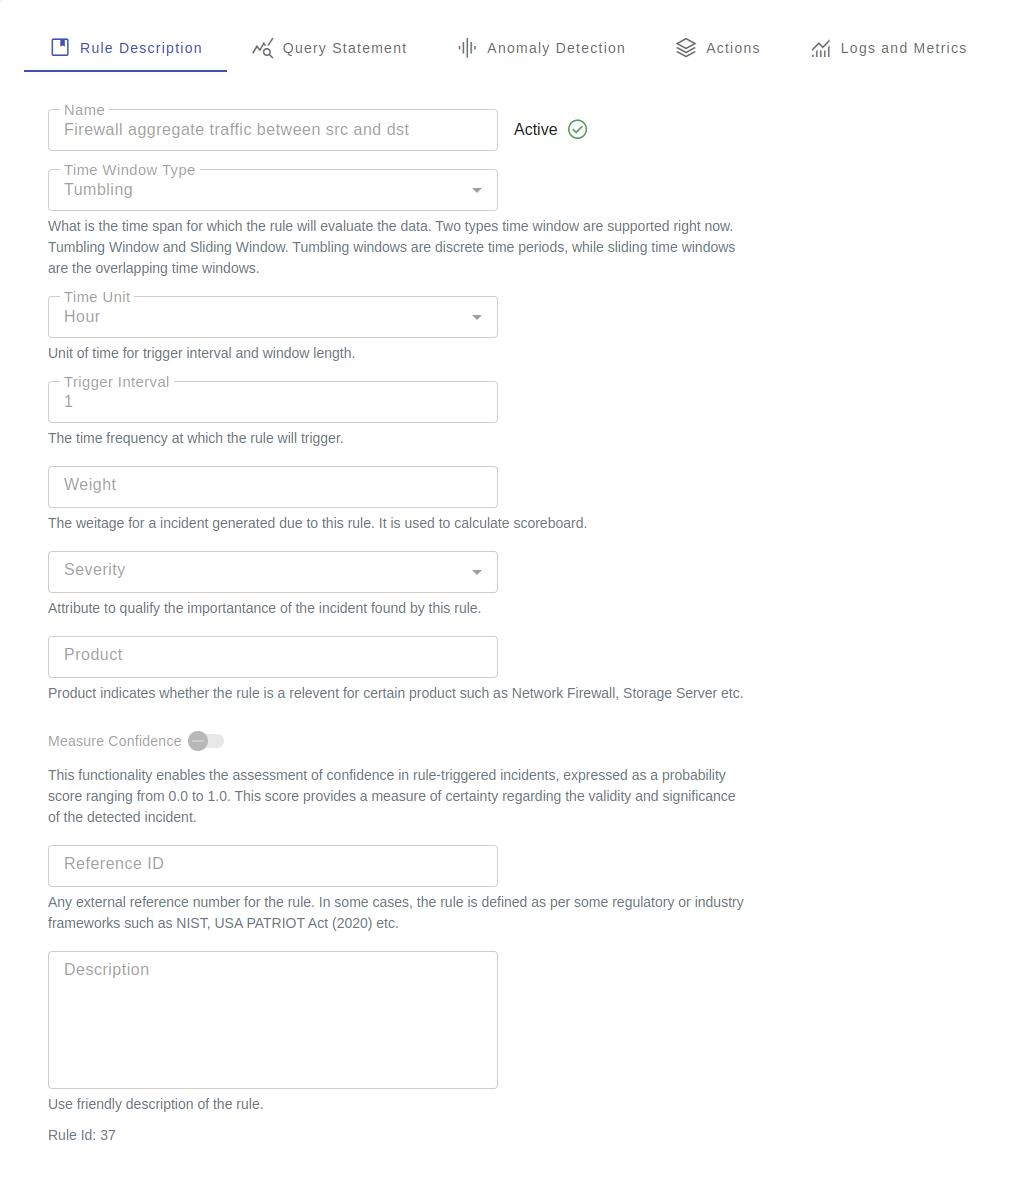
| Time Window Type | What is the time span for which the rule will evaluate the data. Two types time window are supported right now. Tumbling Window and Sliding Window. Tumbling windows are discrete time periods, while sliding time windows are the overlapping time windows. |
| Time Unit | Unit of time for trigger interval and window length. |
| Trigger Interval | The time frequency at which the rule will trigger. |
| Time Window Length | Time period for which data are processed in a single trigger. The time filter to work, the table must select the time column in the table configuration. If the time column is not specified, the time filter is applied on that table. |
| Weight | The weitage for a incident generated due to this rule. It is used to calculate scoreboard. |
| Severity | Attribute to qualify the importantance of the incident found by this rule. |
| Product | Product indicates whether the rule is a relevent for certain product such as Network Firewall, Storage Server etc. |
| Measure confidence | This functionality enables the assessment of confidence in rule-triggered incidents, expressed as a probability score ranging from 0.0 to 1.0. This score provides a measure of certainty regarding the validity and significance of the detected incident. |
| Reference ID | Any external reference number for the rule. In some cases, the rule is defined as per some regulatory or industry frameworks such as NIST, USA PATRIOT Act (2020) etc. |
| Description | Use friendly description of the rule. |
Rule Evaluation Funnel
Each rule has a series of checks to identify incidents. At minimum it requires a query statement to perform the first level of the filtering. Optionally, the rule can also apply a set of techniques such as rare event checks, anomaly detection checks etc. Before an incident is created, it must pass through all steps in the funnel.
Query statement
SQL statement is the first filtering step to identify the relevent events. In many cases, the statement alone is sufficient to identify an suspecious event. The statement contains conditions only qualifying the events, and it does not include any time period filtering condition. The time period window operation is performed by the engine backend.
For example, if you want to check whether the total amount of data exfiltration (bytes_out) by destination IP address (dst_ip) from the firewall exceeds 100 MB, you would write this query:
If you schedule the rule having time window = Sliding and trigger interval = 10 minutes, the engine will check the above rule every 10 minutes over the data accumulated on 10 minutes. The engine keep track of the required checkpoints of the time window boundaries.
You can fine tune the above statement to exclude certain IP addresses.
[Optional] Anomaly Detection
Anomaly detection identifies data points, events, or observations that deviate significantly from the expected pattern or norm within a dataset. These deviations, often referred to as anomalies or outliers, can indicate critical insights or issues, such as fraud, system failures, or unusual patterns of behavior. Anomaly detection currently works for only numeric data. All records from the query statement is passed to the model.
If you want to find anomalies on the time series data, make sure you group the data by a timestamp interval using the query statement. For example, you want to find anomalous hourly aggregate of network bytes outs per IP can be created in the following statemet.
SELECT
    dst_ip,
    date_trunc("hour", ts) AS ts,
    Sum(bytes_out) AS bytes_out
FROM   firewall
GROUP  BY
    dst_ip,
    ts
Attributes
| Attributed | Description |
|---|---|
| Features | Select the numeric attributes using which anomaly detection will be performed. The engine will peform several preprocessing before feeding the data to the model, such null data handling, scaling, mean shifting. |
| Princuple Components | [Optional] This optional steps allows the model to perform a dimentionasionality reduction as a part of the preprocessing steps. |
| Grouping Field | [Optional] The query output for each trigger may represent a single entity or multiple entities, contingent upon the SQL query's structure. In the provided example, the query output pertains to a group of dst_ip values. For such scenarios, consider selecting this grouping field to construct separate anomaly detection models for each group. This approach can enhance model accuracy and performance compared to building a single model for all entities collectively. |
| Contamination | The amount of contamination of the data set, i.e. the proportion of anomalies in the data set. Used when fitting to define the threshold on the decision function. The value varies from (0., 0.5) with the default value 0.1 |
| Algorithm | Select the algorithm for detection of the anomalies. Find the list of the supported algorithms in the following section. |
Anomaly Detection Algoriths
Rule engines uses unsupervised outlier detection technique with the following considerations
- Training data (unlabelled) contains both normal and anomalous observations.
- The model identifies outliers during the fitting process.
- This approach is taken when outliers are defined as points that exist in low-density regions in the data.
- Any new observations that do not belong to high-density regions are considered outliers.
Following algorithms are supported to detect the anomalies.
| Algorithm | Description |
|---|---|
| Angle-based Outlier Detector | ABOD is an unsupervised outlier detection technique that leverages the concept of angular variations between a data point and its neighbors. The underlying principle is that outliers tend to exhibit significantly larger angular variations compared to normal data points. |
| Clustering Based Local Outlier Factor | The Clustering Based Local Outlier Factor (CBLOF) operator calculates the outlier score based on cluster-based local outlier factor. CBLOF takes as an input the data set and the cluster model that was generated by a clustering algorithm. It classifies the clusters into small clusters and large clusters using the parameters alpha and beta. The anomaly score is then calculated based on the size of the cluster the point belongs to as well as the distance to the nearest large cluster. By default, kMeans is used for clustering algorithm. |
| Connectivity-Based Outlier Factor | Connectivity-Based Outlier Factor (COF) COF uses the ratio of average chaining distance of data point and the average of average chaining distance of k nearest neighbor of the data point, as the outlier score for observations. |
| Histogram-based Outlier Detection | Histogram- based outlier detection (HBOS) is an efficient unsupervised method. It assumes the feature independence and calculates the degree of outlyingness by building histograms. Two versions of HBOS are supported: A) Static number of bins: uses a static number of bins for all features. B) Automatic number of bins: every feature uses a number of bins deemed to be optimal according to the Birge-Rozenblac method. |
| IsolationForest Outlier Detector | The IsolationForest (IFOREST) ‘isolates’ observations by randomly selecting a feature and then randomly selecting a split value between the maximum and minimum values of the selected feature. |
| Local Outlier Factor | Local Outlier Factor (LOF) measures the local deviation of density of a given sample with respect to its neighbors. It is local in that the anomaly score depends on how isolated the object is with respect to the surrounding neighborhood. Locality is given by k-nearest neighbors, whose distance is used to estimate the local density. By comparing the local density of a sample to the local densities of its neighbors, one can identify samples that have a substantially lower density than their neighbors. |
| Local Correlation Integral | LOCI is highly effective for detecting outliers and groups of outliers ( a.k.a.micro-clusters), which offers the following advantages and novelties: (a) It provides an automatic, data-dictated cut-off to determine whether a point is an outlier—in contrast, previous methods force users to pick cut-offs, without any hints as to what cut-off value is best for a given dataset. (b) It can provide a LOCI plot for each point; this plot summarizes a wealth of information about the data in the vicinity of the point, determining clusters, micro-clusters, their diameters and their inter-cluster distances. |
Anomaly Detection Configuration
Anomaly detection configurations have three subsets of configurations.
- Feature selection options
- Data preprocessing options
- Algorithm Options
Feature selection options
| Option | Description |
|---|---|
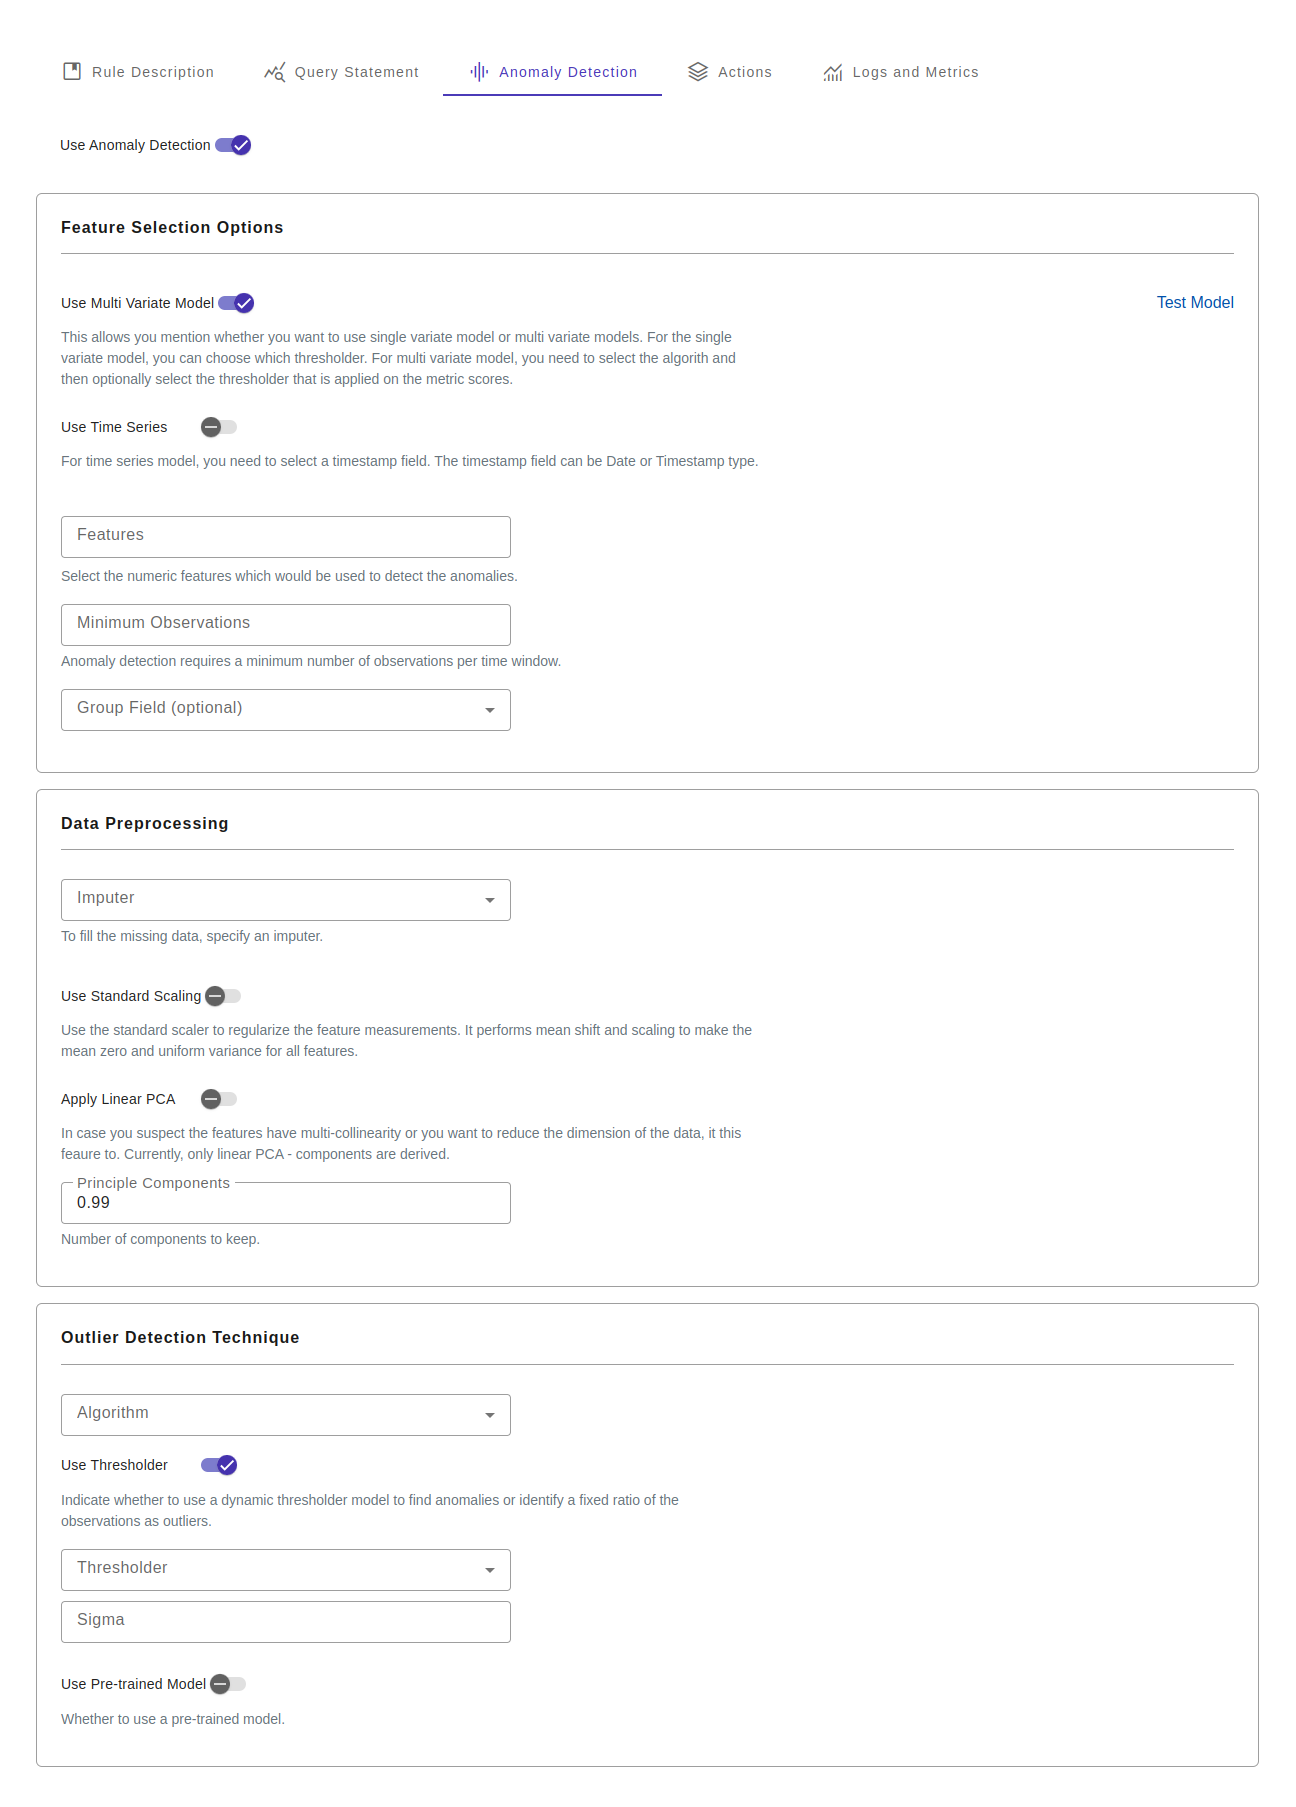
| Single variate model vs multi-variate model | This allows you mention whether you want to use single variate model or multi variate models. For the single variate model, you can choose which thresholder. For multi variate model, you need to select the algorith and then optionally select the thresholder that is applied on the metric scores. |
| Time Series Model | For time series model, you need to select a timestamp field. The timestamp field can be Date or Timestamp type. |
| Time series frequency | Select the time frequency of the observations. For example, daily, hourly or by minute. A number of string aliases are given to useful common time series frequencies. See the table "time series frequecy aliases". |
| Features | Select the numeric features which would be used to detect the anomalies. |
| Minimum Observations | Anomaly detection requires a minimum number of observations per time window. |
Data preprocessing
| Option | Description |
|---|---|
| Imputer | To fill the missing data, specify an imputer. |
| Standard Scaler | Use the standard scaler to regularize the feature measurements. It performs mean shift and scaling to make the mean zero and uniform variance for all features. |
| Principal Components | In case you suspect the features have multi-collinearity or you want to reduce the dimension of the data, it this feaure to. Currently, only linear PCA - components are derived. |
Outlier detection technique
| Option | Description |
|---|---|
| Multi Variate Algorithm | The algorithm used for detecting the outliers using multi variate scenario. |
| Use Thresholder | Indicate whether to use a dynamic thresholder model to find anomalies or identify a fixed ratio of the observations as outliers. |
| Thresholder | Which thresholder algorithm to use. A thresholder is applicable for both single variate and multi-variate models. |
| Fixed Threshold | The amount of contamination of the data set, i.e. the proportion of outliers in the data set. Used when fitting to define the threshold on the decision function. The range of the value is [0.0 to 1.0], 0.1 is a good starting point. |
| Use Pre-trained | Whether to use a pre-trained model. |
| Pre-trained model Id | What is the model ID of the pre-trained model. |
Why do we set the frequency of the data in time series analysis?
- Regular Intervals: Setting a frequency ensures your data points are evenly spaced in time. This is crucial because many time series algorithms and statistical methods assume regular intervals between observations.
- Handling Missing Data: With a set frequency, identify missing time periods and handle them appropriately
- Time-Based Operations: It enables straightforward calculations like rolling averages, shifts, and seasonal decomposition.
- Resampling: You can easily aggregate or downsample data to different time periods:
- Seasonality Analysis: Regular frequencies make it easier to detect and analyze seasonal patterns.
- Forecasting: Many forecasting models work better with regular time intervals, as they make assumptions about the temporal structure of the data.
Time series frequecy aliases
| Alias | Description |
|---|---|
| B | business day frequency |
| W | weekly frequency |
| MS | month start frequency |
| ME | month end frequency |
| h | hourly frequency |
| min | minutely frequency |
| s | secondly frequency |
| ms | milliseconds |
Rule Incidents
Incidents are the outcome of the rule execution. Rule engine executes the rule in a continuos manner to process the data in near realtime. Rules are executed asynchronously on data streams directed to a table. If a rule identifies records that meet its criteria, an incident record is generated.
Relationship between a incident and events (table records) maybe one-to-one or one-to-many depending on the initial query defined in the rule condition.
For example, an incident generated by the follow criteria, would corresponds to a single event.
SELECT
    dst_ip,
    ts,
    bytes_in,
    bytes_out,
FROM   firewall
WHERE
    dst_ip like '103.113.68.23' AND bytes_out > 1024
However, an incident generated by the follow criteria, would likely corresponds to multiple events. The incident record, infact, would not capture the actual event ids, but rather, it captures aggregated summary of the underlying events.
SELECT
    dst_ip,
    date_trunc("hour", ts) AS ts,
    Sum(bytes_out) AS bytes_out
FROM   firewall
GROUP  BY
    dst_ip,
    ts
An incident may be recorded in the alert center, and/or various actions can be triggered, such as sending an email alert, invoking a webhook, or executing a playbook action.
Incident Properties
Following are the core fields on the rule_incident table.
| Field | Type | Description |
|---|---|---|
| id | Bigint | System generated ID |
| rule_id | Bigint | ID of the corresponding rule |
| lower_bound | Timestamp | Lower of the time range. |
| upper_bound | Timestamp | Upper bound of the time range. |
| data | Json | Data (single row) in the query_result. |
Following field values are copied to the rule_incident table from the corresponding rule description.
| Field | Type | Description |
|---|---|---|
| priority | Text | Priority as per the rule description |
| category | Text | Rule category as per the rule description |
| product | Text | Rule product as per the rule description |
| ref_id | Text | Rule ref_id as per the rule description |
| severity | Text | Rule severiry as per the rule description |
| score | Float | Rule weight as per the rule description |
Following field values are copied to the rule_incident table from the query output if they contain these values.
| Field | Type | Description |
|---|---|---|
| table_name | Text | Table_name which contains the raw events. |
| event_id | Text | ID of the event if it is relevent for the rule. For aggregate based, rule it is not relevent. |
| context_id | Text | ID of the context, it may contain device information or user information. This ID may belong to an external system. |
| event_ts | Timestamp | Use this field to capture the timestamp when the event is generated |
| event_user | Text | Use this field to capture user information corresponding to the event. |
Following fields in rule_incident are used to capture the interaction by the operation team.
| Field | Type | Description |
|---|---|---|
| sla | Integer | |
| product | Text | |
| comment | Text | |
| close_date | Date | |
| due_date | Date | |
| status | Text | |
| assigned_id | Lookup(user) |
Handle False Alarm
A common issue to operationalize the rule engine is the high number of false positive incidents. It occurres mostly due to the incompleteness of the rule criteria. To tackle Avalanchio uses a built in machine learning model to measure confidence score for each incidents. To measure the confidence, we need to capture operation team's feedback on the generated incidents to train the machine learning model. The engine uses the query output and rule metadata as feature to train the model, which is used to preodcting true positive likelihood probability.
Rule Actions

Below are the actions that can be triggered by the incidents detected by the rule.

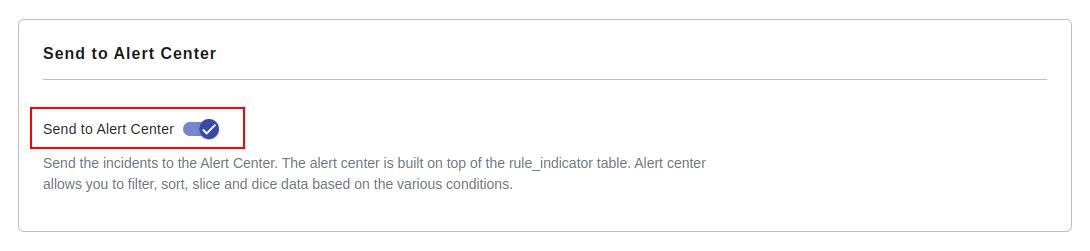
Send to Alert Center
Send the incidents to the Alert Center. The alert center is built on top of the rule_indicator table. Alert center allows you to filter, sort, slice and dice data based on the various conditions.
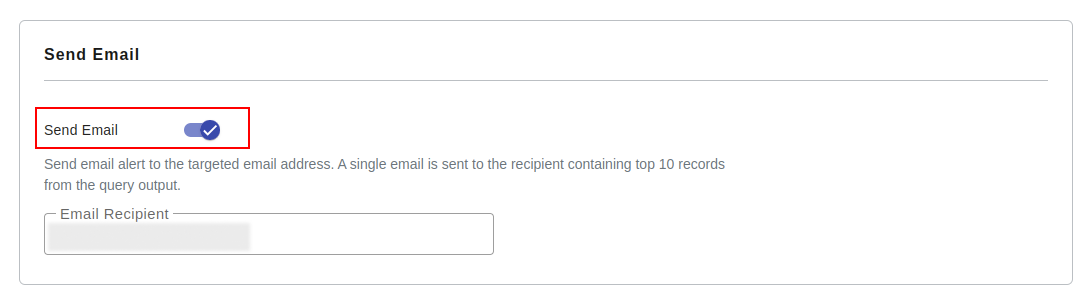
Send email alert
Send email alert to the targeted email address. A single email is sent to the recipient containing top 10 records from the query output.
Call Webhooks
The engine makes web service call to send the rule metadata and the incident records. The endpoint must accept the following request body in the json format.
| Field | Description |
|---|---|
| rule_id | UUID (Guid) of the rule |
| rule_guid | UUID (Guid) of the rule |
| rule_name | Name of the rule |
| rule_severity | Severity of the rule |
| fields | List of fields in the query output |
| records | List of json objects as per the query output |
The endpoint must be a secure endpoint (SSL/TLS) and accessible from Avalanchio servers and HTTP request method must be "POST".
Example:
{
    "log_id": 154568723187846,
    "fields": [
        {
            "name": "datetime",
            "type": "Timestamp"
        },
        {
            "name": "diffuse_flows",
            "type": "DOUBLE"
        },
        {
            "name": "general_diffuse_flows",
            "type": "DOUBLE"
        },
        {
            "name": "humidity",
            "type": "DOUBLE"
        },
        {
            "name": "id",
            "type": "Bigint"
        },
        {
            "name": "name",
            "type": "Text"
        },
        {
            "name": "temperature",
            "type": "DOUBLE"
        },
        {
            "name": "wind_speed",
            "type": "DOUBLE"
        },
        {
            "name": "zone_1_power_consumption",
            "type": "DOUBLE"
        },
        {
            "name": "zone_2_power_consumption",
            "type": "DOUBLE"
        },
        {
            "name": "zone_3_power_consumption",
            "type": "DOUBLE"
        }
    ],
    "records": [
        {
            "datetime": "2017-01-01T01:00:00Z",
            "diffuse_flows": 0.096,
            "general_diffuse_flows": 0.099,
            "humidity": 73.7,
            "id": 1748123545,
            "name": null,
            "temperature": 4.92,
            "wind_speed": 0.083,
            "zone_1_power_consumption": 21654.68354,
            "zone_2_power_consumption": 13582.97872,
            "zone_3_power_consumption": 14480.96386
        },
        {
            "datetime": "2017-01-01T01:00:00Z",
            "diffuse_flows": 0.89,
            "general_diffuse_flows": 0.809,
            "humidity": 66.11,
            "id": 1748123617,
            "name": null,
            "temperature": 13.89,
            "wind_speed": 0.076,
            "zone_1_power_consumption": 39469.36709,
            "zone_2_power_consumption": 24251.67173,
            "zone_3_power_consumption": 25792.77108
        }
        ],
    "date_range": {
        "end": 1483254000000,
        "start" :1483232400000

    },
    "rule_guid": "d9a741c0-62fc-4de1-a701-f50dc603bb2a",
    "rule_id":46,
    "rule_name":"Power Consumption by every hour",
    "severity":"Informational"
}
Authentication Details Webhoook Endpoint
Current the rule engine accept two type authentication mechanisms.
A. Basic Authentication
B. Jwot Token based authentication.
Look into the details of Webhook about how to configure and test the webhook.
In some environment, if exposing a web service endpoint is not feasible, alternative is to run a playbook as described in the next section.
Timeout
You can set the timeout of the webhook configuration. Default timeout is 120 seconds.
Example of webhook defined using python flask
import uuid

from flask import Flask, request, jsonify
import random
from time import sleep
app = Flask(__name__)

def verify_payload(payload:dict):
    rule_id = payload.get("rule_id")
    assert rule_id is not None, "rule_id is not found"
    assert isinstance(rule_id, int), "rule_id must be int"
    rule_guid = payload.get("rule_guid")
    assert rule_guid is not None, "rule_guid is not found"
    assert isinstance(rule_guid, str), "rule_guid must be str"
    rule_name = payload.get("rule_name")
    assert rule_name is not None, "rule_name is not found"
    assert isinstance(rule_name, str), "rule_name must be str"
    log_id = payload.get("log_id")
    assert log_id is not None, 'Execution log_id is not found in the request'
    date_range = payload.get("date_range")
    assert date_range is not None
    assert isinstance(date_range, dict), "date_range must be a dict with start and end"
    assert isinstance(date_range.get('start'), int), 'date_rate.start must be int'
    assert isinstance(date_range.get('end'), int), 'date_rate.end must be int'
    fields = payload.get("fields")
    assert fields is not None, 'fields are not found'
    assert isinstance(fields, list), 'fields must be list, but found ' + str(type(fields))
    records = payload.get("records")
    assert records is not None, "No records are found"
    assert isinstance(records, list), 'records must be list, but found ' + str(type(records))

@app.route("/power-consumption/alert-action", methods=['POST'])
def power_consumption_alert_action():
    try:
        payload = request.json
        print(f"Payload: {payload}")
        verify_payload(payload)
    except Exception as e:
        return jsonify({
            'status': 'Failed',
            'message': str(e)
        }), 400

    return jsonify({
        "status": "Success",
        "message": s
    })

if __name__ == "__main__":
    app.run(debug=False, port=4567)
Execute Playbook
You can write your business logic as a Python script to handle the json payload. The structure of the payload is same as that in the webhooks. You need to run an agent application in the backend on a server that you manage, which keeps making long polling requests to the Avalanchio service over secure http looking for any pending tasks in the queue related to the rule.
Example of python playbook:
def process(payload):

    """
    This method is called when a new task is assigned by the rule.
    @param payload: dictionary, the payload which contains
                    the metadata about the rule and the query_result
    @return: str, message indicating status of the processing.
             The response value is recorded in the rule_exec_log table
             for reporting purpose.
    """
    print(payload)
Note: the method name must be process (case-sensitive). The agent invokes this method from the playbook script.
For information about playbook, look into the playbook documentation. view
Use cases for playbooks:
You can use the playbooks for various automation, for example: - Lock/unlock some user account in an application - Use your own notification infrastructure for sending alerts. - Create a ticket in your internal ITSM system.
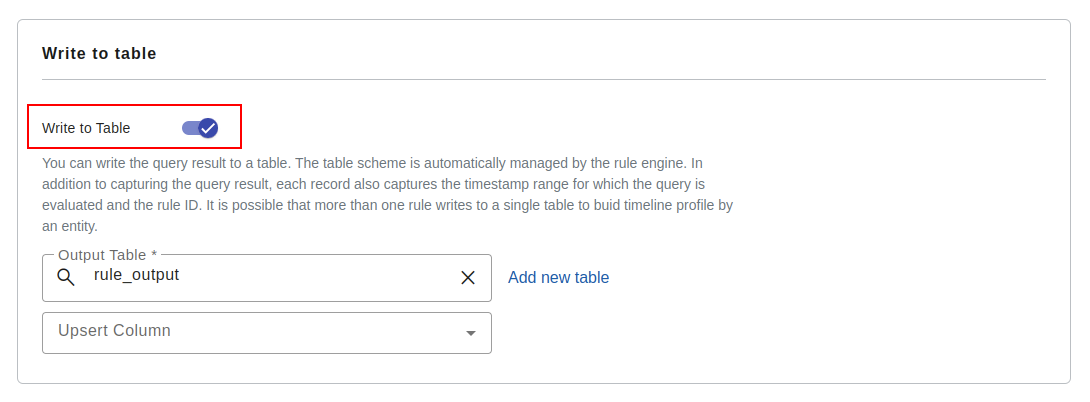
Write to table
You can write the query result to a table. The table scheme is automatically managed by the rule engine. In addition to capturing the query result, each record also captures the timestamp range for which the query is evaluated and the rule ID. It is possible that more than one rule writes to a single table to buid timeline profile by an entity.
In case you are collecting output from multiple rule to the same table, you must ensure that out field field alias and data type are exactly same for each rule.
Limit number of indicidents
You can enforce a limit on the number of incidents triggered actions in a rolling 24 hours period.
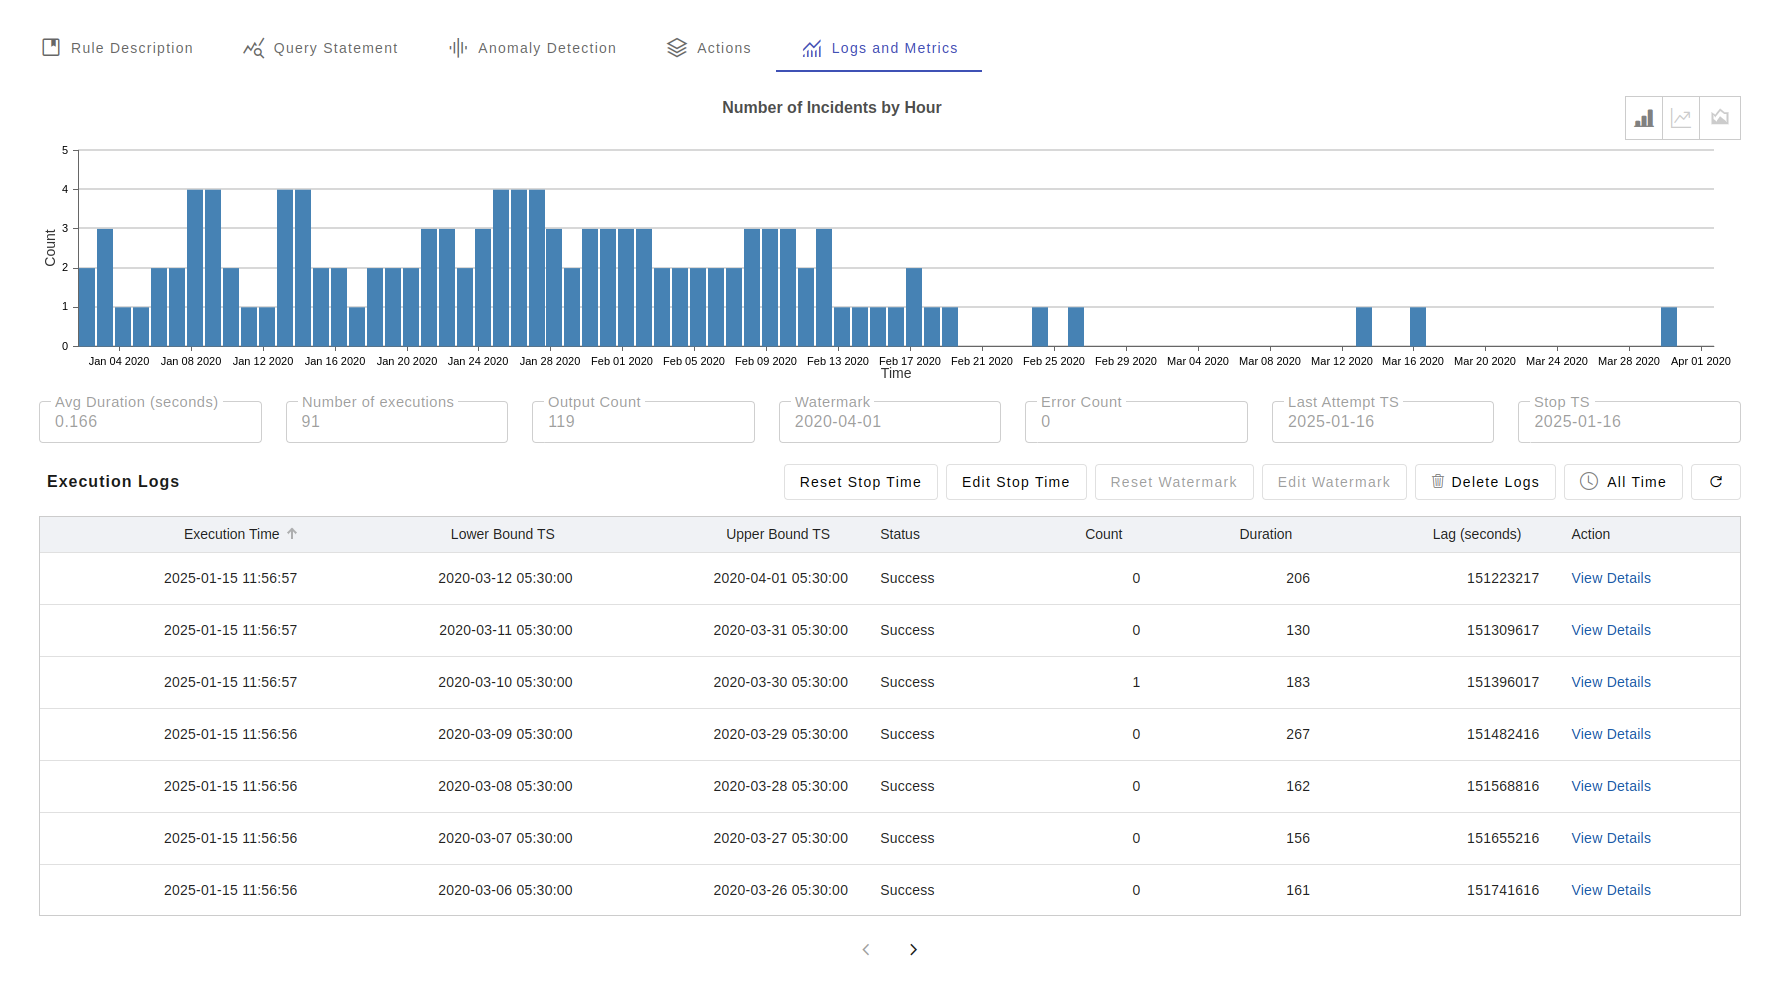
Logs and Metrics
Each invocation of the rule is recorded in rule_exec_log table. Following are the fields in the table.
| Field | Type | Description |
|---|---|---|
| id | Bigint | System generated log id |
| ts | Timestamp | Rule triggering timestamp |
| status | Text | Status of the rule trigger |
| rule_id | Bigint | ID of the corresponding rule |
| message | Text | Any error while during execution |
| duration | Integer | Total duration of the rule execution |
| count | Intger | Number of incidents generated by the rule |
| lag_period | Intger | Lag period of the rule execution |
| lower_bound | Timestamp | Lower bound of the timestamp window range of the events |
| upper_bound | Timestamp | Upper bound of the timestamp window range of the events |
| query_output | Intger | Number of records in the query result from the SELECT query statement |
| query_duration | Intger | Duration taken to execute the SELECT query |
| email_sent | Intger | Number of email sent |
| email_duration | Intger | Duration taken to send the email |
| email_error | Text | Any error while sending the email |
| webhook_duration | Intger | Duration taken to call webhook action |
| webhook_error | Text | Any error while call the webhook action. |
| webhook_response | Text | Response from the webhook. First 4KB message is captured as text. |
| anomaly_duration | Intger | Duration taken by anomaly detection algorith. |
| anomaly_error | Text | Any error while processing the anomaly detection algorithm. |
| anomaly_ratio | Float | Ratio of the anomalies with respect to the query output count. |
| playbook_duration | Intger | Duration taken by the playbook execution. |
| playbook_error | Text | Any error while executing playbook action. |
| playbook_response | Text | Response message from the playbook. |
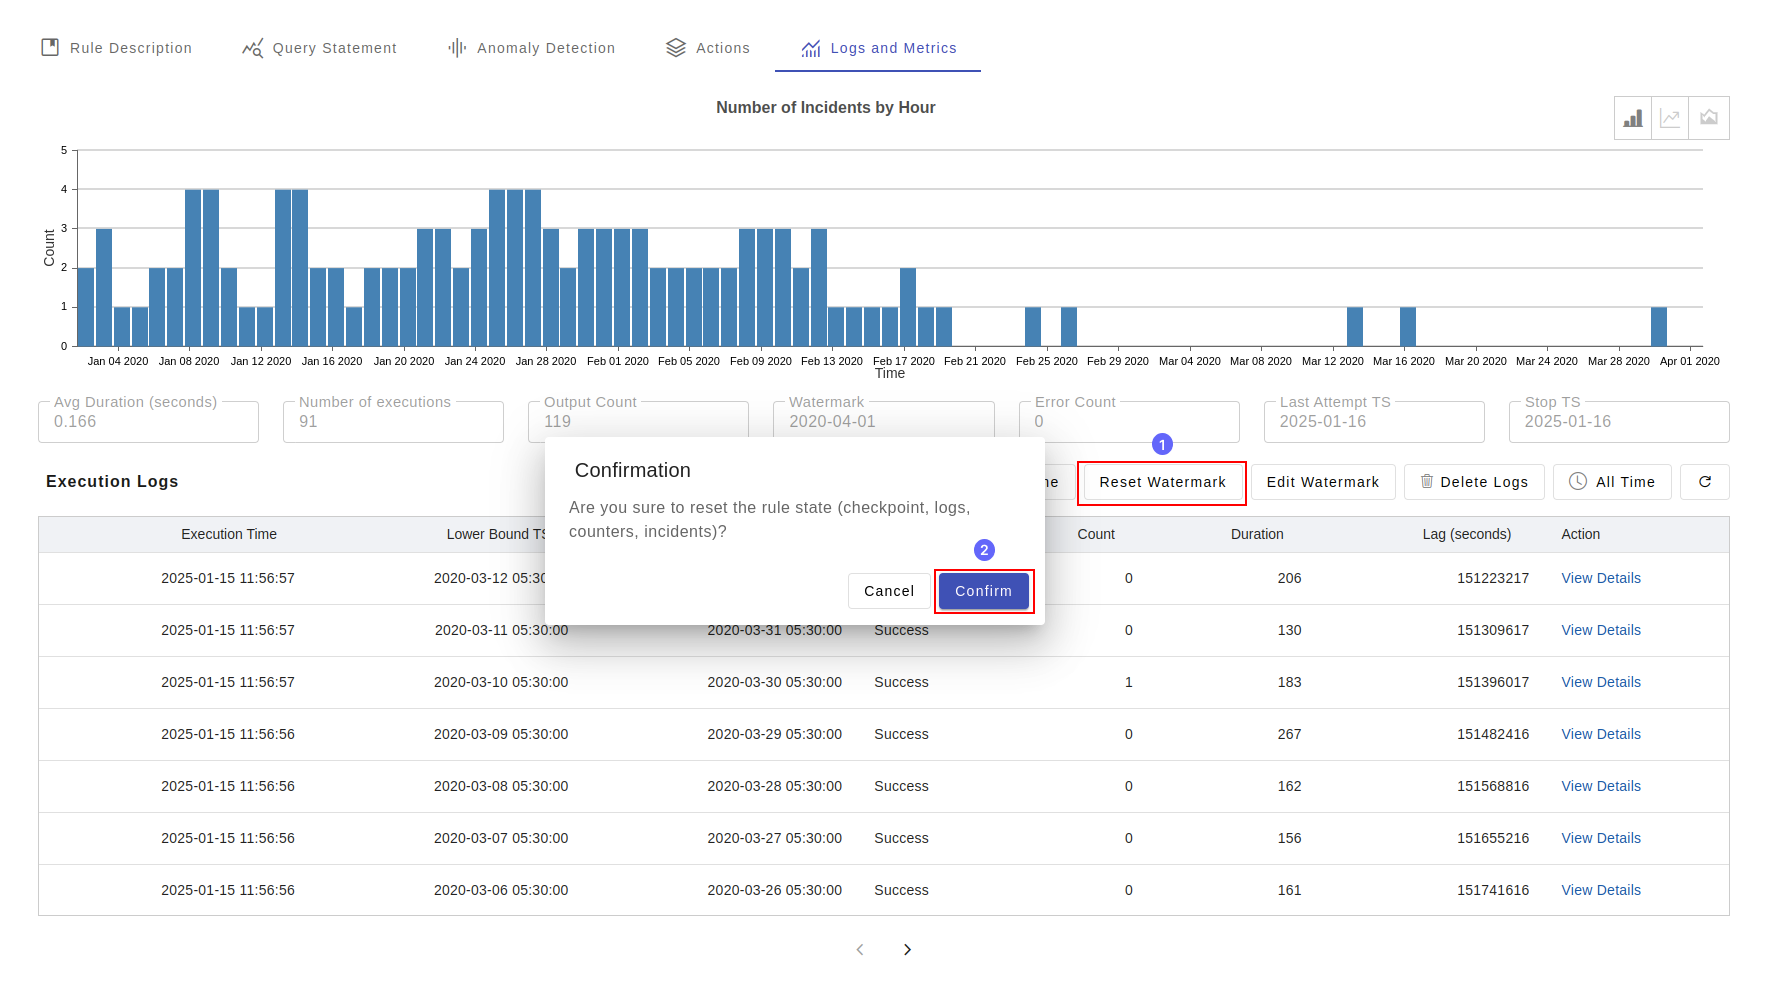
Reset Checkpoint
Rule engine incrementally processes the data in a continuous manner. It uses id value of a table to record to as watermark to track how much data the engine has processed at a given point of time. Note: the "id" field values in a table are system generated, unique, and is monotonotically increasing sequence numbers. When the rule is trigger, it checks the last checkpoint values - that is id and timestamp and to determine the scope of execution. During development and testing you may setup a rule, test the rule, when the test is over, you like to delete all rule output, checkpoints and logs. That is where the "Reset" checkpoint feature comes to play. When you "Reset Checkpoint", it deletes the checkpoint, logs, and incidents corresponding the rule.
Back Testing
If you want to test certain rule in the historical data or maybe you want to start the rule execution at a given timepoint, you select the option "Edit Checkpoint". You will get three options:
| Option | Description |
|---|---|
| Set watermark to the earliest event | It sets the checkpoint to the earliest record found in the corresponding tables. |
| Set watermark to the latest event | It sets the checkpoint to the current timestamp and processing any new data that inserted into the table. |
| Set custom watermark | In this option you set an arbitrary value of the timestamp, where from where you to like start reading data. |
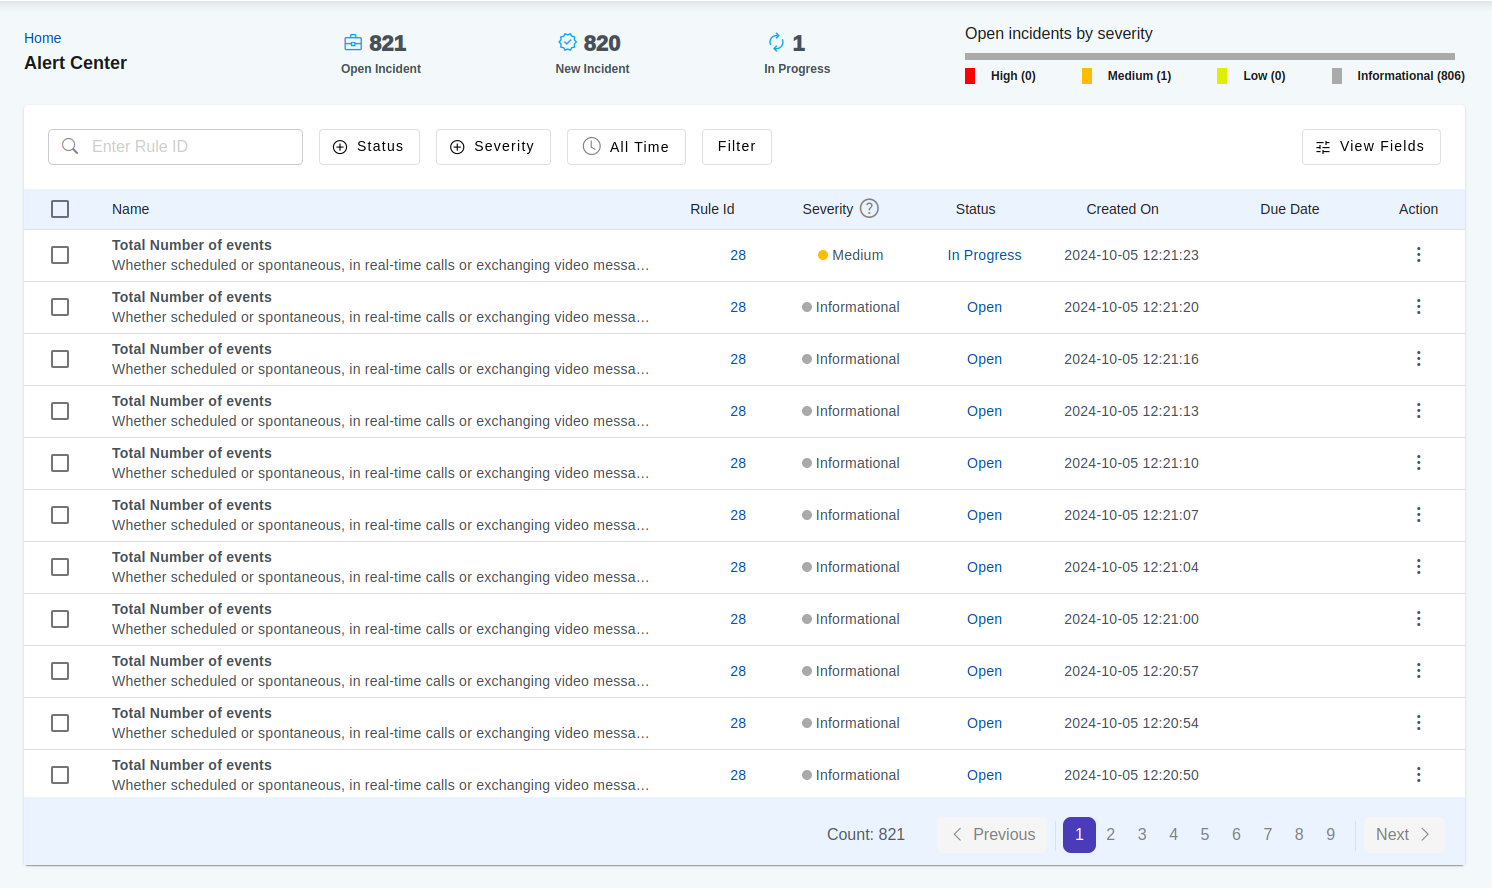
Alert Center
Alert center is the cockpit for the operations team view the rule incidents and take actions.